Friday, October 13, 2006

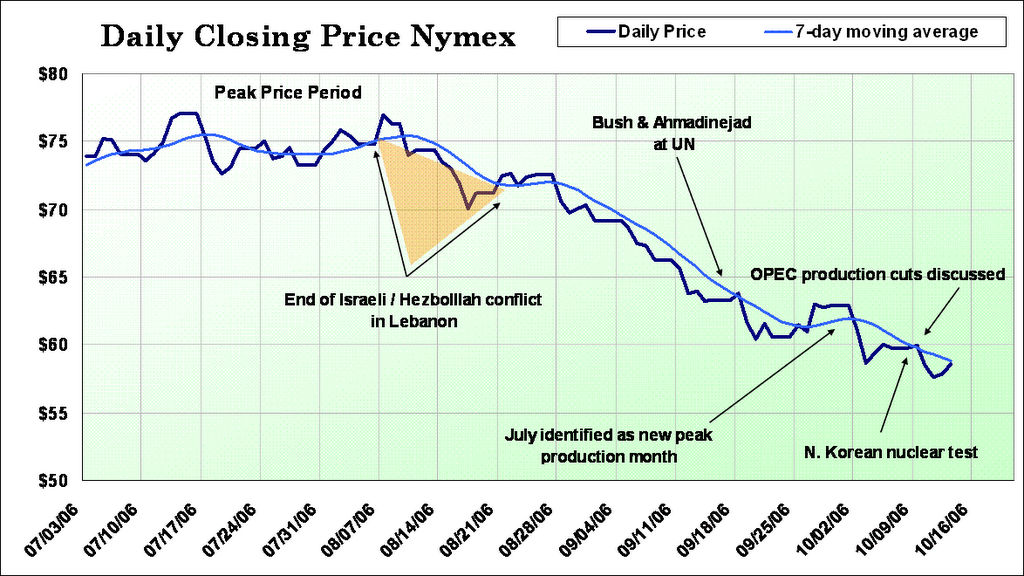
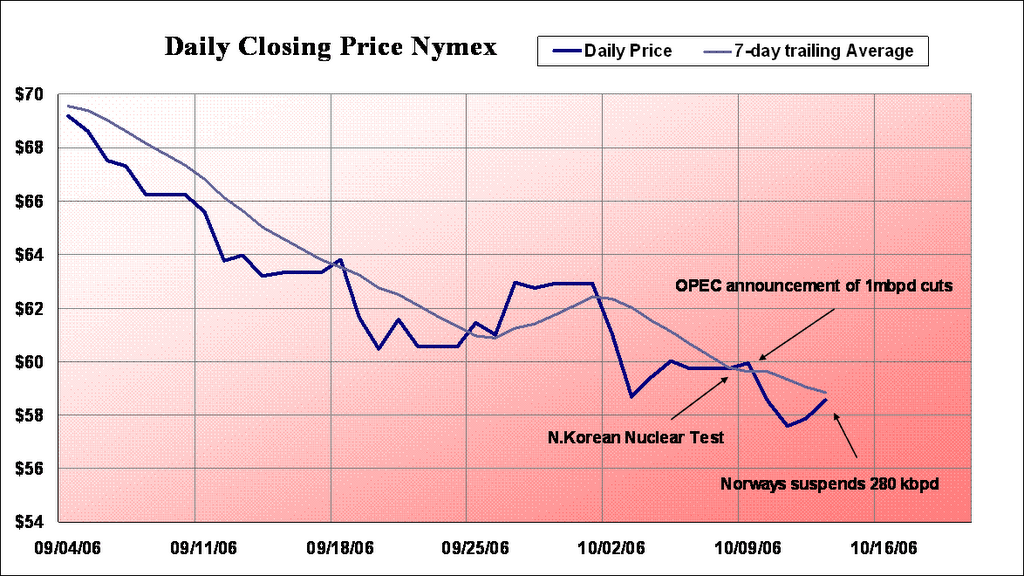
Daily Crude Oil Price


The grid lines mark weeks, starting on Mondays. The flat sections at the end of weeks are Friday, Saturday, and Sunday. I used the closing price on Friday all the way until the closing price on Monday. On very long weekends, this price lasts from Friday until Wednesday of the following week. I know there are price movements in these periods, but I am using published once-a-day data and I wanted to make the graph spacially accurate.

[This is the last of a series of looks at recent price. Now I've got to go back and update the others.]

To Follow

Zoom out once. (done - ptII)
Zoom out twice(start it about $65).

Fix -Set start of Hezbollah's rocket attacks July 12th

Production and Price.

Crude vs. Natural Gas

Then move onto gasoline.

Thursday, October 12, 2006

Daily Price of Oil (Part II)


I screwed this one up. The first day of the Lebanon conflict was Wednesday, July 12th. That, of course, is on this graph. I was thinking it was the 30th of June for some reason. That was the start of Gaza, which was the necessary pre-cursor. My how time flies.

Referencing my own notes here, Oil closed at $75 on this Wednesday and set the record at $77 two days later.

My point with this study - is to show that the Lebanon conflict and its short-term resolution is often given as both the reason for the peak and it's subsequent correction. Nothing could be farther from the truth.

Price had already reached these levels previous to Gaza, never moved significantly higher once the conflict broke out, and moved well below them once the conflict was "resolved."

Of course, Gaza still rages. The Lebanon thing is temporarily on hold.

[edit] this is horrible. I need to check my prices and dates. We had a higher price the week before conflict erupted. Which helps my argument thank god.