Oil vs. GDP 1970-1982
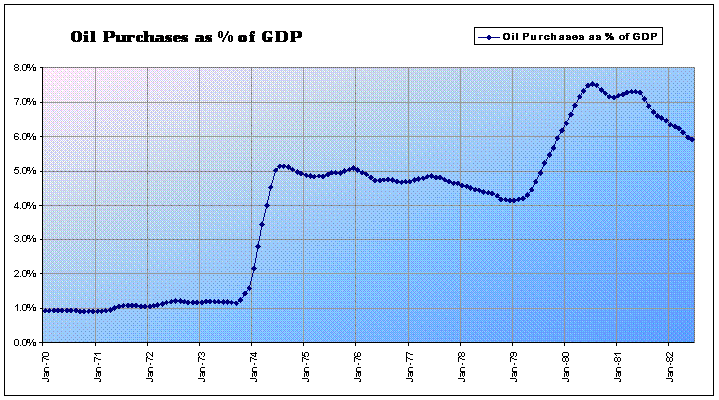
This is just a preliminary graph showing United States total petroleum products used cost figured as percentage of GDP. Dollar values used are original nominal values. I should have next 25 years tomorrow.
posted by Oil CEO @ 10:34 PM
3 comments
![]()

3 Comments:
Bill here - this is good - can you do a comparison of US vs Japan vs China. I saw something that says japan is way ahead in $ of GDP per unit of oil. they have been forced to be much more efficient becuase no supply. US got better after the oil crisis, but has slipped back in the past 20 years. china is the worst - they are still using "brute force" - much less efficient and there fore much more exposed to oil price changes
Good to hear from you, Bill. I am still working on all your questions and these issues as well. I have no excuses except a severe case of writer's block and laziness. I should snap out of it soon. If you see previous posts disappear, it is because I am just sweeping up. I've got all these comments saved and am working on them exclusively. I'm just using this GDP thing to get back in the swing of things. Again, I apologize for the time-frame here - it turns out I am a slave to my own pace. I thank you for your patience.
Yeah, Japan and, notably, the UK have stopped increasing their oil usage growth in regards to GDP growth.
I would recommend Peter Tertzakian's '1000 Barrels a Second' for you. Excellent book. I think you would like it a great deal. If, for whatever reason, this does not appeal to you, I would recommend a cup of coffee at your nearest bookstore while you skim through the book for what he has to say about British and Japanese growth. Or you can wait for me to cover it soon.
Very pretty design! Keep up the good work. Thanks.
»
Post a Comment
<< Home